


| News
Exclusive: The report of the Banking and Monetary Supervision Department on Commercial Banks’ Uses of Foreign Exchange
Our source obtained exclusively the report of the Banking and Monetary Supervision Department on Commercial Banks’ Uses of Foreign Exchange during the period (1/1 – 28/2/2023)
The total uses of foreign exchange by banks from 1/1 – to 28/2/2023 amounted to about $3,078,886,837 compared to $2,676,748,043 during the same months of 2022, with an increase of about $402,138,794 million, and a growth rate of 15.0%.
The letter of credits accounted for 56.3% of total bank uses of foreign exchange, personal purposes accounted for 42.4% of total bank uses of foreign exchange, while transfers accounted for only 1.3% of total uses.
The actual banks’ uses of foreign exchange for all purposes ” Million USD ”
| Expense | From 1/1 to 28/02 of 2022 | From 1/1 to 28/02 of 2023 | Change in value | Percentage change |
| Letters of Credits | 1,617,993,788 | 1,732,107,206 | 114,113,418 | 7.1 |
| Transfers | 15,512,179 | 42,387,668 | 26,875,490 | 173.3 |
| Personal uses | 1,043,242,076 | 1,304,391,963 | 261,149,887 | 25.0 |
| Total | 2,676,748,043 | 3,078,886,837 | 402,138,794 | 15.0 |
Amounts sold to banks in foreign exchange for all purposes:
Within the framework of the Banking and Monetary Supervision Department’s follow-up to the accepted purchase requests for letter of credits and remittances, submitted by commercial banks through the system for following-up requests for coverage, and foreign exchange sales for personal purposes, in accordance with the decision of the Board of Directors of the Central Bank of Libya No. (1) of 2020 regarding amending the exchange rate of the Libyan dinar and Banking and Monetary Supervision Department Circular No. (9/2020).
The total amounts of foreign exchange sold to banks from 1/1 – to 28/2/2023, through the system for following up purchase and coverage requests, and foreign exchange sales for personal purposes at the Central Bank of Libya, amounted to about $3,078,886,837 compared to $2,676,748,043 during the same months of 2022, with an increase of about $402,138,794 million.
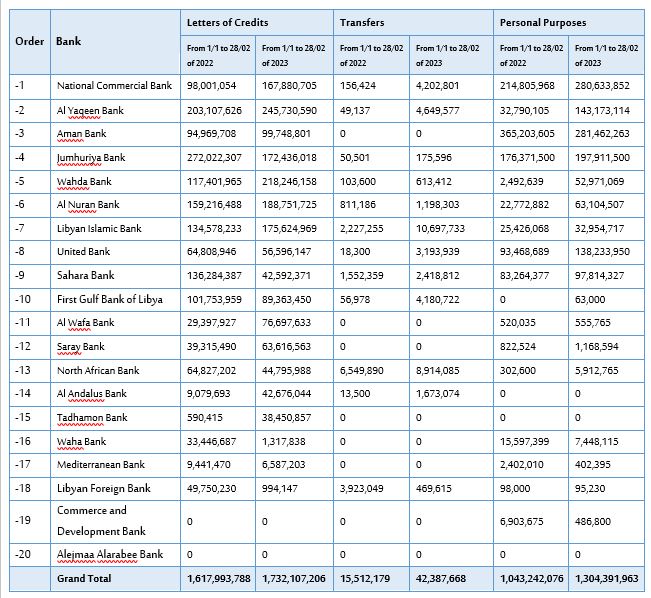
According to the table below, which illustrates the values sold of foreign exchange by banks, it is clear that National Commercial Bank was the most bank purchased foreign exchange from 1/1 – to 28/2/2023, maintaining its first rank among the banks with relative importance of 14.7%, as the total amounts of foreign exchange used was about $452,717,358, followed by Al Yaqeen Bank with a value of $393,553,280, ahead of Al Aman Bank for Trade and Investment, which was in third place with a value of $381,211,064. Then Jumhouria Bank ranked fourth with a value of $370,523,114, then the following banks come in terms of relative importance in order: Al-Wahda Bank, Al-Nouran Bank, the Libyan Islamic Bank, the United Bank and the Sahara Bank, etc. of the banks as shown in the table below, which also contains the order in which they were Banks during the same period last year 2022.
Ranking of banks according to the total amounts sold of foreign exchange

Amounts sold to banks in foreign exchange.
(According to purpose)
“In of USD”
Second: Accepted bank requests to cover Letters of Credits and transfers, except for personal purposes, from 1/1 – to 28/02/2023: The number of companies, factories, public entities and other entities reached (855) whose applications were approved to purchase foreign exchange from 1/1 – to 28/02/2023, with a number of applications amounting to 2400 applications. Most of these applications were made to cover letters of credits, which was 2099 applications, 87.5% of the total: as shown in the following table:
| Transfer type | Number of requests | Relative Importance % |
| Letters of Credits | 2099 | %87.5 |
| Commercial Transfers | 107 | %4.5 |
| Airlines Transfers | 73 | %3.0 |
| Other Transfers | 68 | %2.8 |
| Insurance Transfers | 31 | %1.3 |
| Salary Transfers – Foreigners | 22 | %0.9 |
| Total | 2400 | 100.0 % |
Banks’ requests to cover letters of credit and transfers
(According to the beneficiary countries)
The table below shows the values of banks’ requests to purchase foreign exchange by beneficiary countries from1/1 – to 28/02/2023, it is clear that 44.4% of bank transfers to cover letters of credit or other transfers were to the United Arab Emirates, whereas Turkey was in second place with a rate of 8.1%, followed by Switzerland and Tinisia with rates of 5.7 % and 5.6%, respectively.
| Order | Beneficiary Country | Value in USD | Relative Importance % |
| 1- | United Arab Emirates | 860,329,014 | 44.4 |
| 2- | Turkey | 156,098,175 | 8.1 |
| 3- | Switzerland | 110,939,579 | 5.7 |
| 4- | Tunisia | 109,163,426 | 5.6 |
| 5- | China | 100,972,990 | 5.2 |
| 6- | Italy | 86,236,403 | 4.5 |
| 7- | South Korea | 78,558,946 | 4.1 |
| 8- | Egypt | 51,961,063 | 2.7 |
| 9- | Spain | 47,987,357 | 2.5 |
| 10- | Hong Kong S.A.R. | 44,885,494 | 2.3 |
| 11- | United Kingdom | 38,556,933 | 2 |
| 12- | Thailand | 25,057,797 | 1.3 |
| 13- | Germany | 24,049,384 | 1.2 |
| 14- | Austria | 24,000,378 | 1.2 |
| 15- | Netherlands | 22,488,141 | 1.2 |
| 16- | France | 18,920,244 | 1 |
| 17- | Canada | 10,256,714 | 0.5 |
| 18- | Japan | 10,155,027 | 0.5 |
| 19- | Sweden | 9,351,522 | 0.5 |
| 20- | Belgium | 7,822,227 | 0.4 |
Banks requests to buy foreign exchange
(According to the countries of origin for the goods or services)
The table below shows the values of banks’ requests to purchase foreign exchange by goods or services origins from 1/1 – to 28/02/2023, It is clear that Egypt ranked first, as goods or services of Egyptian origin accounted for 18.8% of the total accepted purchase requests. Imports of goods or services of Turkish origin came in second place, accounting for 18.1% of the total, and goods or services of Chinese origin accounted for 9.8% ranked third during the period, while goods and services of Tunisian origin accounted for 6.5%, and those of Indian origin accounted for 6.0%. The following table shows twenty countries of origin for goods or services.
| Order | Country of origin of goods or services | Value in USD | Relative Importance % |
| 1- | Egypt | 363,179,649 | 18.8 |
| 2- | Turkey | 350,177,437 | 18.1 |
| 3- | China | 189,749,218 | 9.8 |
| 4- | Tunisia | 125,707,046 | 6.5 |
| 5- | India | 116,333,277 | 6 |
| 6- | Russian Federation | 112,146,618 | 5.8 |
| 7- | South Korea | 70,454,512 | 3.6 |
| 8- | Italy | 59,866,529 | 3.1 |
| 9- | Ukraine | 52,963,860 | 2.7 |
| 10- | United Arab Emirates | 49,889,553 | 2.6 |
| 11- | Germany | 44,977,829 | 2.3 |
| 12- | Brazil | 30,888,123 | 1.6 |
| 13- | Spain | 30,035,510 | 1.6 |
| 14- | Thailand | 26,353,462 | 1.4 |
| 15- | United States | 25,227,049 | 1.3 |
| 16- | Argentina | 24,705,475 | 1.3 |
| 17- | Netherlands | 21,484,414 | 1.1 |
| 18- | Hong Kong S.A.R. | 21,449,638 | 1.1 |
| 19- | Europe | 15,590,895 | 0.8 |
| 20- | Belgium | 14,732,632 | 0.8 |
Accepted bank requests to buy foreign exchange according to sectors
From 1/1 – to 28/02/2023
| Sector | Number of companies, factories, or entities |
| Private Sector | 806 |
| Public Sector | 23 |
| Banking Sector | 3 |
| Foreigners (Salary Transfers) | 23 |
| Total | 855 |
Private sector:
The number of private sector companies and factories were (806) whose requests foreign exchange to cover letter of credits and other transfers were approved, they constituded of 769 companies and 37 factories from 1/1 – to 28/02/2023. Banks’ requests to purchase foreign exchange by the private sector to import production and operation requirements ranked first among total purchase requests during the period, accounting for 13.1% of total foreign exchange purchase requests. While the requests to cover the import of raw materials for the requirements of the aluminum and PVC industry ranked second in terms of relative importance, constituting about 5.4%, whereas the requests to cover the import of durum wheat accounted for 4.0% and the import of iron 4.0% of the total, and the following table shows the purchase requests for the fifty most important commodities or services during the period from1/1 – to 02/28/2023.
Purchase orders for the fifty most important goods or services – Private Sector
From 1/1 – to 28/02/2023
| Order. | Goods or services | Value in USD | Relative Importance % |
| 1 | Production and operation requirements | 226,201,784 | 13.1 |
| 2 | Raw materials for aluminum and PVC industry supplies | 92,998,461 | 5.4 |
| 3 | Durum wheat | 70,042,385 | 4.0 |
| 4 | Iron | 69,510,431 | 4.0 |
| 5 | Sugar | 59,425,358 | 3.4 |
| 6 | Electronic Equipment | 55,227,492 | 3.2 |
| 7 | Cars | 45,507,474 | 2.6 |
| 8 | Cleaning materials | 42,403,960 | 2.4 |
| 9 | Maize | 41,813,600 | 2.4 |
| 10 | Building materials | 39,755,158 | 2.3 |
| 11 | Mobile phones and their accessories | 39,520,777 | 2.3 |
| 12 | Cooking oil | 38,798,903 | 2.2 |
| 13 | Agricultural machinery | 36,902,840 | 2.1 |
| 14 | Soft wheat | 33,604,278 | 1.9 |
| 15 | Carton | 31,851,906 | 1.8 |
| 16 | Tuna | 30,685,654 | 1.8 |
| 17 | Building materials for floors and tiles | 28,142,455 | 1.6 |
| 18 | Refrigeration and Air Conditioning Appliances | 26,257,955 | 1.5 |
| 19 | Barley | 24,698,000 | 1.4 |
| 20 | Other Furniture | 22,401,233 | 1.3 |
| 21 | Miscellaneous electrical appliances | 22,133,196 | 1.3 |
| 22 | Packaging materials and papers | 22,041,170 | 1.3 |
| 23 | Soy | 21,468,066 | 1.2 |
| 24 | Tomato paste | 21,438,251 | 1.2 |
| 25 | Grilles | 21,433,048 | 1.2 |
| 26 | Biscuits, chocolate and sweet | 20,580,742 | 1.2 |
| 27 | Tires | 19,796,559 | 1.1 |
| 28 | Packaging Paper | 19,731,092 | 1.1 |
| 29 | Frozen meat | 18,560,281 | 1.1 |
| 30 | Medicine | 18,242,895 | 1.1 |
| 31 | Poultry and frozen poultry meat | 17,898,930 | 1.0 |
| 32 | Baby Milk | 17,738,936 | 1.0 |
| 33 | Cigarettes and tobacco of all kinds | 16,922,227 | 1.0 |
| 34 | Medical Equipment | 16,353,690 | 0.9 |
| 35 | Electronic Equipment | 15,482,780 | 0.9 |
| 36 | Oxes | 14,453,323 | 0.8 |
| 37 | Wood | 14,373,000 | 0.8 |
| 38 | Refractory bricks | 13,859,057 | 0.8 |
| 39 | Diapers | 13,340,708 | 0.8 |
| 40 | Feeds | 12,677,855 | 0.7 |
| 41 | Milk powder | 11,936,511 | 0.7 |
| 42 | Processed cheese | 11,604,219 | 0.7 |
| 43 | Empty cans | 10,401,023 | 0.6 |
| 44 | TV screens | 10,243,601 | 0.6 |
| 45 | Automotive Oils and Machinery | 9,819,247 | 0.6 |
| 46 | Household and Electrical Materials | 9,642,229 | 0.6 |
| 47 | Evaporated milk | 8,457,337 | 0.5 |
| 48 | Tea | 8,449,779 | 0.5 |
| 49 | Agricultural Production Requirements | 7,614,107 | 0.4 |
| 50 | Computers and Accessories | 7,425,127 | 0.4 |
Purchase orders according to the fifty most important companies – Private Sector
From 1/1 – to 28/02/2023
| Order. | Company or factory | Value in USD |
| 1 | Al Bonyan Company for Smelting and Rolling Metals | 37,875,965 |
| 2 | Almaosem Company for Food Industries and Rice Mills | 34,017,845 |
| 3 | Haoth Shamal Afriqyah Company for the manufacture, desalination and bottling of drinking water | 26,112,400 |
| 4 | Al Naseem Food Industries | 23,160,384 |
| 5 | Alduda Alalameyah Alola Company for Feed Industry, Flour Mills and Food Industries | 21,818,420 |
| 6 | Al Mamoura Alola Company for Importing Foodstuffs | 19,218,104 |
| 7 | Doroob Libya Company for Importing Transportation Vehicles and Accessories | 17,778,785 |
| 8 | Alwesam Adahabee Company for the manufacture of flour, mills, feed and rice mills | 17,775,800 |
| 9 | Wadi Al-Kouf Company for Mills, Feed and Rice Mills | 17,293,300 |
| 10 | Almotahadah Aljadeed Company for Tobacco, Cigarettes and Accessories | 13,449,714 |
| 11 | Badya Al Khair Company for Mills, Feed and Pasta | 13,371,780 |
| 12 | Bonyan Libya Almostakbal Company for importing electrical and non-electrical appliances and materials, spare parts and appliances | 13,113,956 |
| 13 | Al-Rayhan Company for Food Industry | 12,918,756 |
| 14 | Aljahez Company for Importing Foodstuffs | 12,731,200 |
| 15 | Thel Ateen Company for the manufacture of dairy and its derivatives | 12,502,000 |
| 16 | Jood Alola Company for Importing Raw Materials | 12,347,628 |
| 17 | Alasalla Adahabyah Company for Mills and Rice Mills | 12,309,000 |
| 18 | Al-Roken Company for Aluminum Industry | 11,957,378 |
| 19 | Al-Ikhtar Company for PVC Industry | 11,744,103 |
| 20 | Alrokon Alelektroni Company for the manufacture of electronic and electrical devices | 11,656,554 |
| 21 | Al-Raed Group Company for Importing Raw Materials | 11,545,600 |
| 22 | Al-Jayed Food Industries Company | 11,360,165 |
| 23 | Alafdal Company for Raw Materials | 10,841,400 |
| 24 | Adwaa Al Nayzak Company for importing electronic devices, accessories and spare parts | 10,484,991 |
| 25 | Al-Jayed Food Industries Company | 10,401,924 |
| 26 | Afaq Algad Aljadeed Company for the import of electrical and non-electrical devices and materials and spare parts | 9,930,650 |
| 27 | Arafeek Addaeam Company for Importing Cars and Spare Parts | 9,877,170 |
| 28 | Ibtahj Atabeesa Company for Importing Foodstuffs | 9,770,000 |
| 29 | Toyota Libya Automotive and Spare Parts Trading and Import and Export | 9,693,967 |
| 30 | Al-Itqan Group Company for the manufacture of cleaning materials | 9,429,930 |
| 31 | Lamsat Alhayah Company for importing medical equipment, medicines, medical preparations, mother and child supplies | 9,406,740 |
| 32 | Sama Almarai Company for Mills, Feed Industry and Rice Mills | 9,130,237 |
| 33 | Nibras Al-Khair Company for Feed Industry and Grain Milling | 9,088,080 |
| 34 | Al Sadd Company for Animal Feed Industry | 8,800,000 |
| 35 | Tarabulus Alkobra Company for the manufacture, packaging and packaging of tomatoes and foodstuffs | 8,680,000 |
| 36 | Awtar Assenaa Company for the manufacture of electronic and electrical devices | 8,671,905 |
| 37 | Shams Al-Watan First Company for Importing Electrical and Electronic Appliances, Accessories and Spare Parts | 8,526,141 |
| 38 | Al-Sawaed Company for Wood Industries | 8,519,474 |
| 39 | Assad Alalee Company for the manufacture of electronic devices | 8,439,964 |
| 40 | Tawasol Company for Paper Industries | 8,167,925 |
| 41 | Al Shorouq Allebyah Company for Mills and Feed | 8,112,000 |
| 42 | Anwar Almadenah Company for the import of electrical and non-electrical devices and materials and spare parts | 8,105,267 |
| 43 | Anahj Alamthal Company for Food Industries | 7,871,315 |
| 44 | Almosem Almotamyez Company for the manufacture of flour, feed and rice mills | 7,789,839 |
| 45 | Alfaeada Adahabyah Company for Food Industries | 7,707,161 |
| 46 | Africa Beverage Bottling Company | 7,698,361 |
| 47 | Sheryan Alhayah Company for Importing Foodstuffs | 7,600,000 |
| 48 | Asayel Libya Company for Importing Building Materials, Sanitary Materials and Accessories | 7,523,260 |
| 49 | Al-Rasheed Company for the manufacture of electronic and electrical devices | 7,307,675 |
| 50 | Almarai Alkesbah Company for Mills, Feed and Rice Mills | 7,240,950 |
Public Sector
The number of public sector companies whose requests for foreign exchange to cover letters of credits and other transfers were approved reached 23 companies from 1/1 – to 28/02/2023. Where banks’ requests to purchase foreign exchange by the Social Solidarity Fund to supply cars for people with disabilities, ranked first in total purchase requests during the reported period, accounting for 26.3% of the total foreign exchange purchase requests, while the requirements of Libyana Mobile Phone Company ranked the second with relative importance of 25.0%, whereas requests to cover the import of production and operation requirements accounted for 22.5%. The following table shows purchase requests from 1/1 – to 28/02/2023.
Purchase orders by commodity or services – Public sector
From 1/1 – to 28/02/2023
| Order. | Goods or services | Value in USD | Relative Importance % |
| 1 | General Authority for Social Insurance Fund – Supply of cars for people with disabilities | 51,900,000 | 26.3 |
| 2 | Libyana Mobile Phone Company Requirements | 49,363,211 | 25.0 |
| 3 | Production and operation requirements | 44,579,436 | 22.5 |
| 4 | General Electricity Company Supplies | 8,039,172 | 4.1 |
| 5 | Almadar Aljadeed Company | 7,887,467 | 4.0 |
| 6 | Communications and IT Services | 7,689,778 | 3.9 |
| 7 | Electronic Devices | 4,333,530 | 2.2 |
| 8 | Housing and Utilities Projects Authority | 4,061,781 | 2.1 |
| 9 | Airline Transfers | 3,403,734 | 1.7 |
| 10 | Afriqiyah Airways | 2,712,739 | 1.4 |
| 11 | Insurance Company Transfers | 2,440,191 | 1.2 |
| 12 | Port operation and maintenance requirements | 2,436,025 | 1.2 |
| 13 | Stationery | 1,994,750 | 1.0 |
| 14 | Libya Telecom and Technology Company | 1,323,811 | 0.7 |
| 15 | Social Welfare Fund | 1,300,694 | 0.7 |
| 16 | Libyan Airlines Requests | 1,232,452 | 0.6 |
| 17 | Household and Electrical | 813,828 | 0.4 |
| 18 | Building Materials and Construction Supplies | 740,896 | 0.4 |
| 19 | Operating needs of Muamalat | 634,800 | 0.3 |
| 20 | State Company for Importing Security Goods | 578,825 | 0.3 |
| 21 | Libyan Ports Company | 215,939 | 0.1 |
| 22 | Port Operating Requirements | 15,112 | 0.0 |
Purchase requests by entities – Public sector
From 1/1 – to 28/02/2023
| Order. | Entity Name | Value in USD |
| 1 | Libyana Mobile Phone Company | 72,327,904 |
| 2 | General Authority of the Social Solidarity Fund | 51,900,000 |
| 3 | Administrative Centers Development Authority | 20,268,177 |
| 4 | Almadar Aljadded Company | 14,191,141 |
| 5 | General Electricity J.S.C | 8,039,172 |
| 6 | Afriqiyah Airways | 6,116,473 |
| 7 | Housing and Utilities Projects Implementation Authority | 4,061,781 |
| 8 | Libya Company for Communication and Technology | 3,148,210 |
| 9 | National Cement Company | 2,604,713 |
| 10 | Authority for the Construction and Maintenance of Ports and Fishing Harbors | 2,315,300 |
| 11 | Libya Insurance Company | 2,204,431 |
| 12 | General Company for Paper and Printing | 1,994,750 |
| 13 | Libyan International Telecommunications Company | 1,732,527 |
| 14 | Social Welfare Fund at the Ministry of Interior | 1,300,694 |
| 15 | Libyan Airlines | 1,232,452 |
| 16 | Aljeel Aljadded Technology Company | 1,123,447 |
| 17 | Systems Company for Electrical Construction J.S.C | 813,828 |
| 18 | Muamalat Financial Services Company | 634,800 |
| 19 | State Company for Importing Security Goods J.S.C | 578,825 |
| 20 | Alenma Electric Investment Company | 380,132 |
| 21 | Libyan Ports Company | 351,776 |
| 22 | Libyan Federation of Insurance Companies | 235,760 |
| 23 | Misurata Free Zone | 141,878 |
Banking Sector:
Accepted Coverage Requests – Banking Sector
From 1/1 – to 28/02/2023
“Descending order”
| Order. | Bank | Value in USD |
| 1 | United Bank for Commerce and Investment | 3,193,939 |
| 2 | Al Andalus Bank Company | 674,944 |
| 3 | Alaman Bank for Trade and Investment | 385,949 |
According to Goods and Services – Banking Sector
“Descending order”
| Order. | Goods or Services | Value in USD |
| 1 | Operating expenses for Commercial banks | 3,193,939 |
| 2 | Al-Andalus Bank Transfer | 674,944 |
| 3 | Machinery and Equipment | 385,949 |
According to Country of Origin – Banking Sector
“Descending order”
| Order. | Country of Origin | Value in USD |
| 1 | Bahrain | 3,193,939 |
| 2 | United States | 450,000 |
| 3 | France | 284,539 |
| 4 | Canada | 200,000 |
| 5 | China | 101,410 |
| 6 | India | 20,000 |
| 7 | United Kingdom | 4,944 |
According to Beneficiary Country – Banking Sector
“Descending order”
| Order. | Beneficiary Country | Value in USD |
| 1 | Bahrain | 3,193,939 |
| 2 | United States | 650,000 |
| 3 | France | 284,539 |
| 4 | Morocco | 101,410 |
| 5 | India | 20,000 |
| 6 | United Kingdom | 4,944 |
Foreigners (salary transfers):
Accepted Coverage Requests
Foreign Transfers – Salaries
From 1/1 – to 28/02/2023
| Order. | Entity | Value in USD |
| 1 | (22) Salary transfers for foreigners | 501,552 |
| 2 | Flight Transfer – Transfer of surplus sales to Tunisian services | 297,058 |
According to Beneficiary Country – Foreign Transfers (Salaries)
| Order. | Beneficiary Country | Value in USD |
| 1 | Tunisia | 297,058 |
| 2 | Ukraine | 139,716 |
| 3 | Poland | 116,000 |
| 4 | Egypt | 86,650 |
| 5 | Jordan | 55,770 |
| 6 | Bulgaria | 47,000 |
| 7 | Germany | 19,580 |
| 8 | India | 19,500 |
| 9 | Italy | 11,402 |
| 10 | Philippines | 5,934 |
Private Sector Appendices
Accepted coverage requests for the private sector from 1/1 – to 28/02/2023:
List of all beneficiary companies and factories
Purchase Orders by Goods or Services
Purchase orders by country of origin of goods or services and the beneficiary country.


